Project: I worked independently and as part of a team to produce optimized editorial graphics for Connections Education, which is now known as Pearson's Online & Blended Learning. I developed original graphics and illustrations based on an approved Pearson Style Guide that corresponded to detailed storyboards for a variety of multimedia and video elements.
Role: Graphics Production Designer / Remote Independent Contractor
Tools Used: Adobe Illustrator, Photoshop, MacBook Pro, Wacom Tablet, iPad Pro, Apple Pencil
Description: I created editorial graphics for educational multimedia resources, adhering to established branding and accessibility standards. Often the graphics were designed to be interactive and therefore required thoughtful design of the user interface. To facilitate collaboration with the course development team, I created and organized the deliverables to exact specifications.
Result: Over the years, I created a variety of digital graphics for Social Studies and Science courses of varying grade levels. I enjoyed this work immensely, and meticulously setting the deliverables up for interactivity granted me a new perspective on the ever evolving process of modern graphic design.
Cartographic Designs
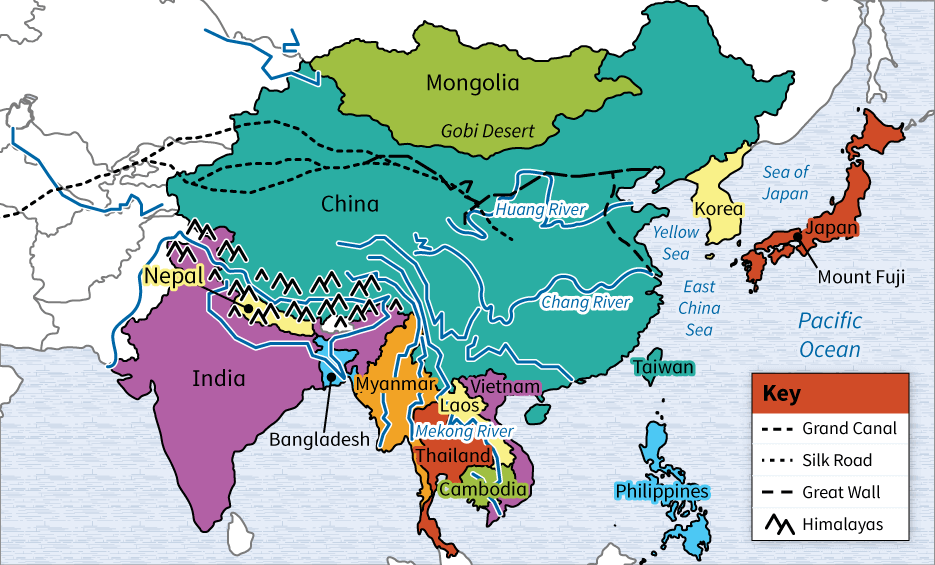
Static Map: Historical Map of Asia which illustrates several natural and man-made geographical features discussed in the accompanying lesson
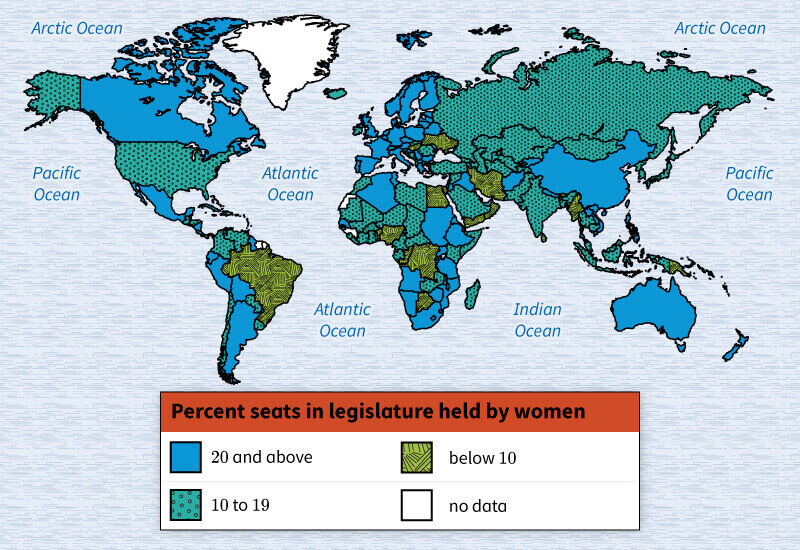
Static Map: World Map Infographic with key illustrating the percent of seats held by women in each country's legislature
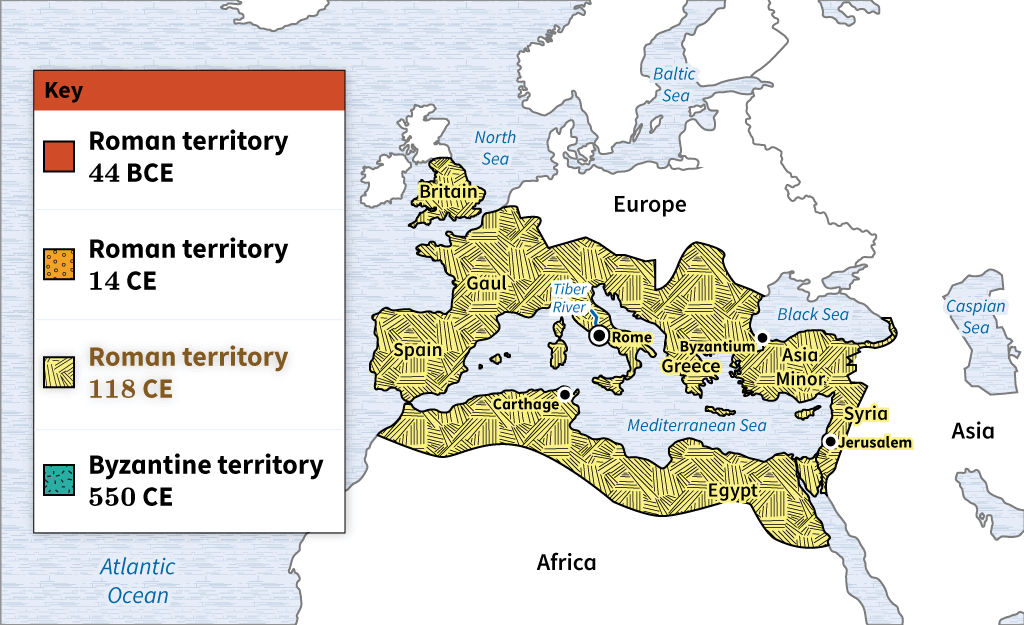
Interactive Map: selecting one of the options in the key would display the corresponding one of four overlays on the map, depicting that particular territory during the chosen year
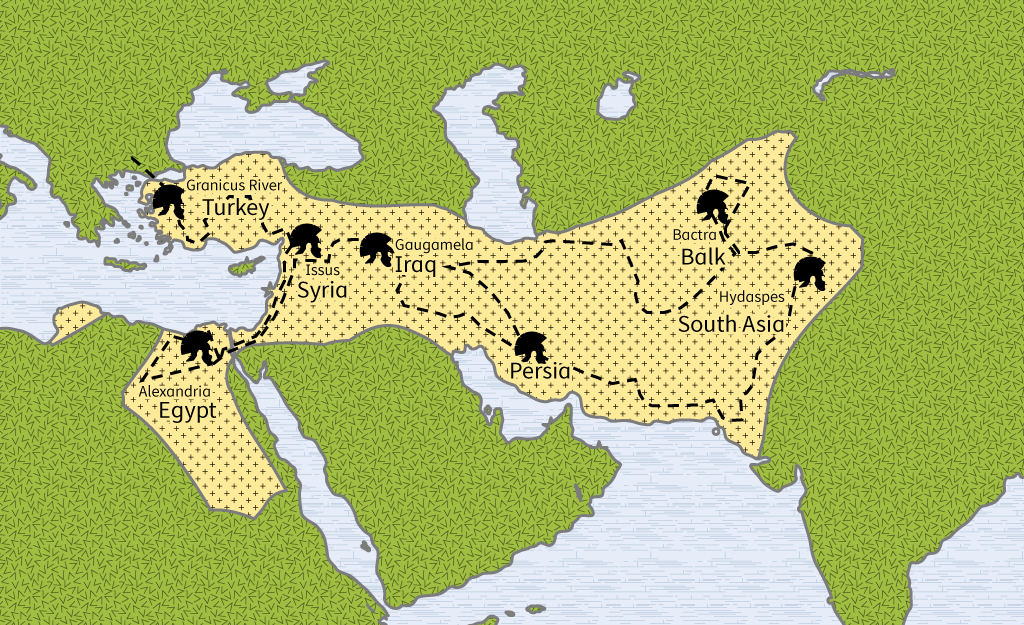
Interactive Map: a path is revealed as each icon is selected to illustrate Alexander the Great's path of conquest
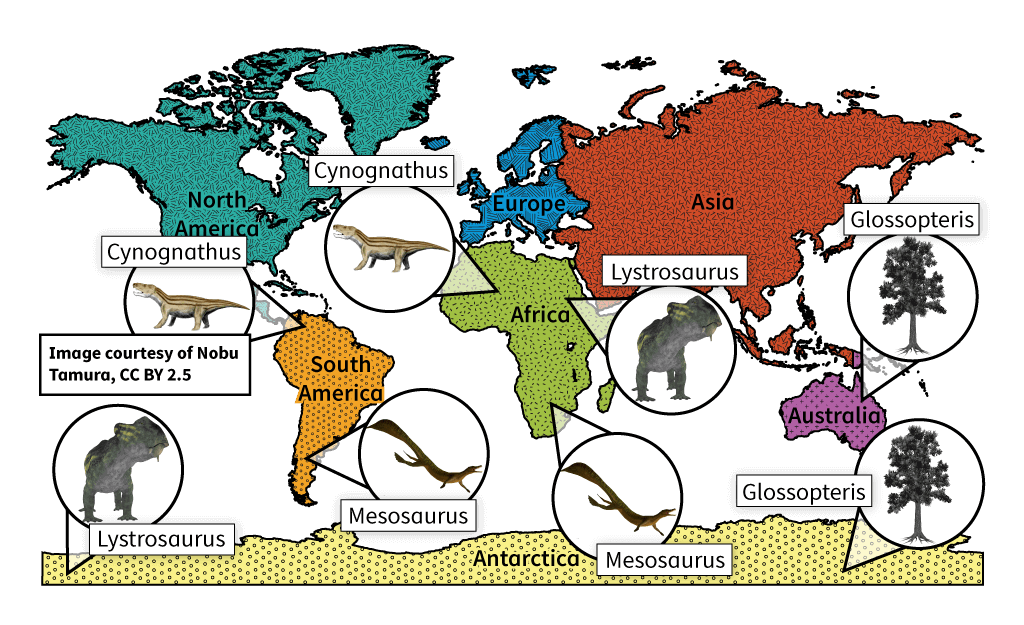
Interactive Map: a pop-up would appear on cursor rollover of hotspots on this world map to display an ancient life-form native to that geographical area
Infographics
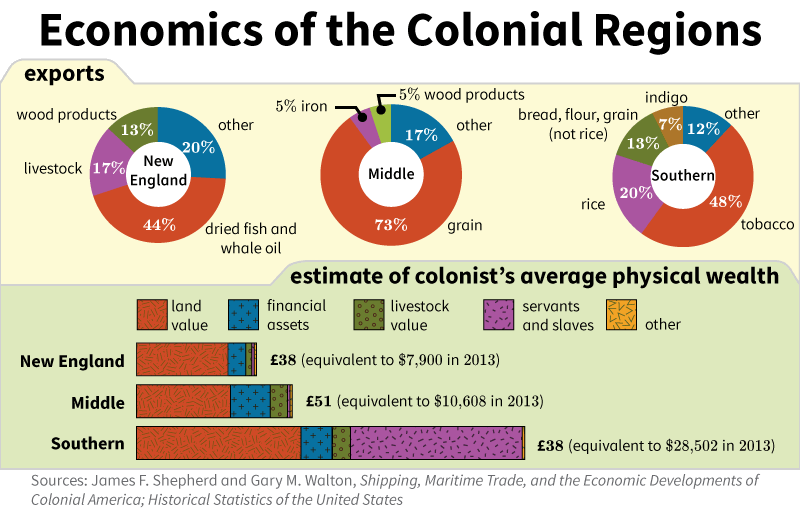
Static Infographic: a combination of pie and bar charts are implemented in this historical infographic

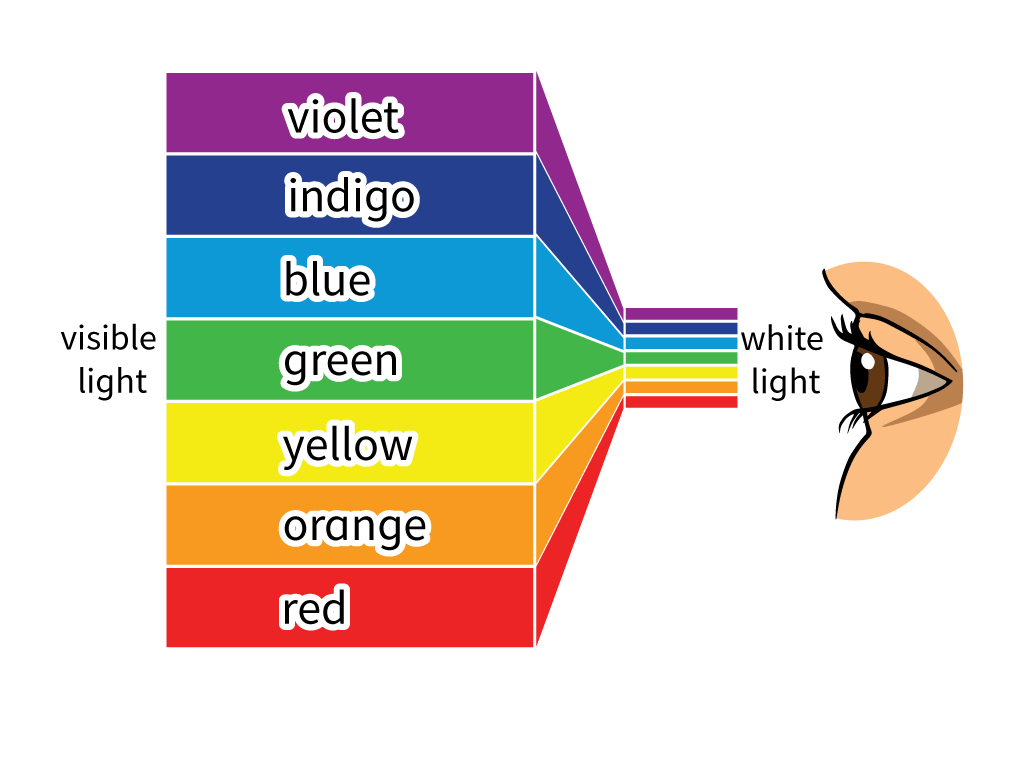
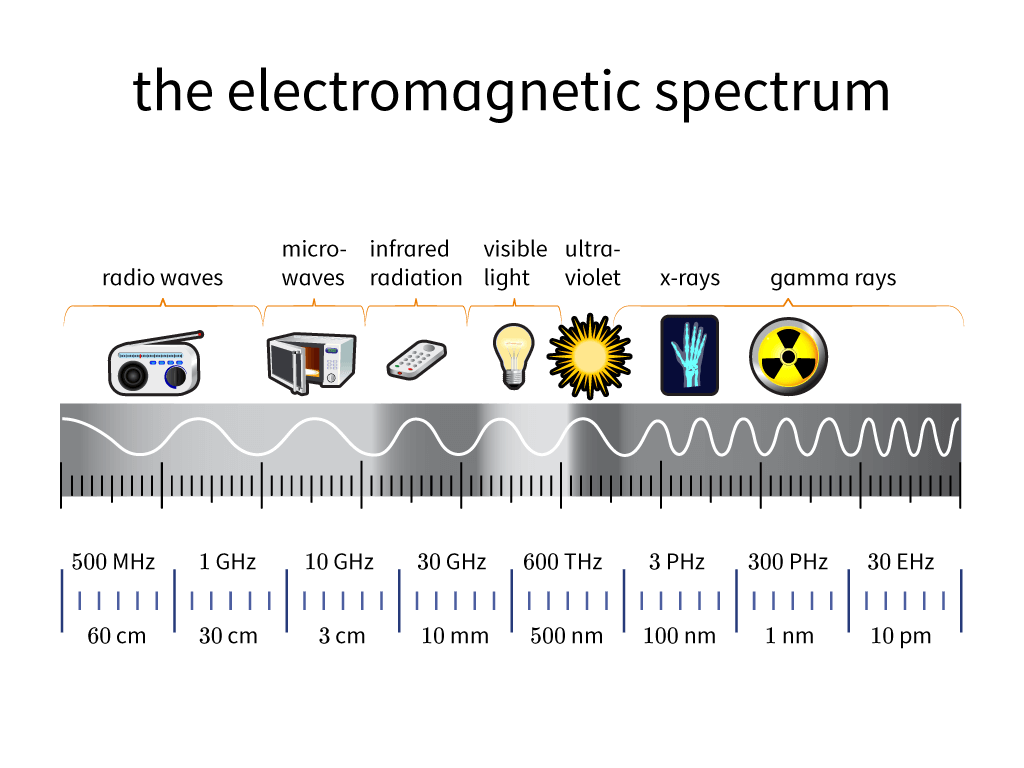
Static Infographic: vibrant colors enhance expression of the concept this scientific infographic conveys
Interactive Infographic: an overlay displaying the corresponding measurements appear below the main graphic when triggered

Interactive Timeline: draggable boxes with names of battles would be dropped into the appropriate dashed box to match the date on the timeline when each battle occurred
Interactive Graphics
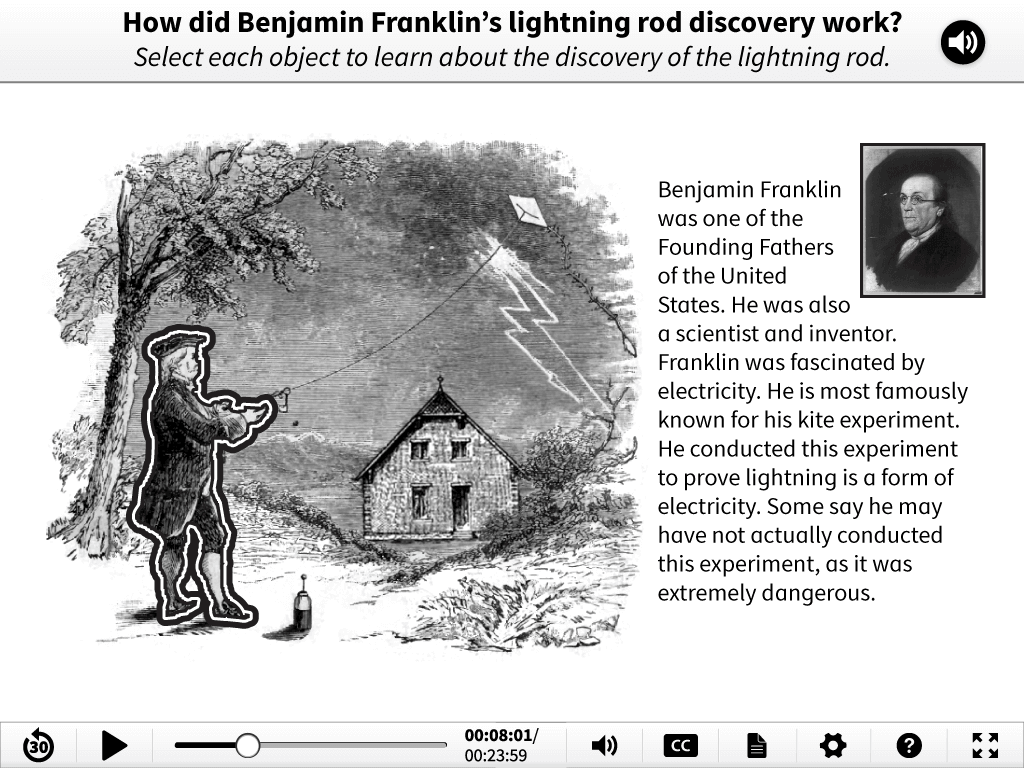
Interactive Art: choosing certain objects in the image area outlines them on selection, then relevant text and imagery would appear on the right
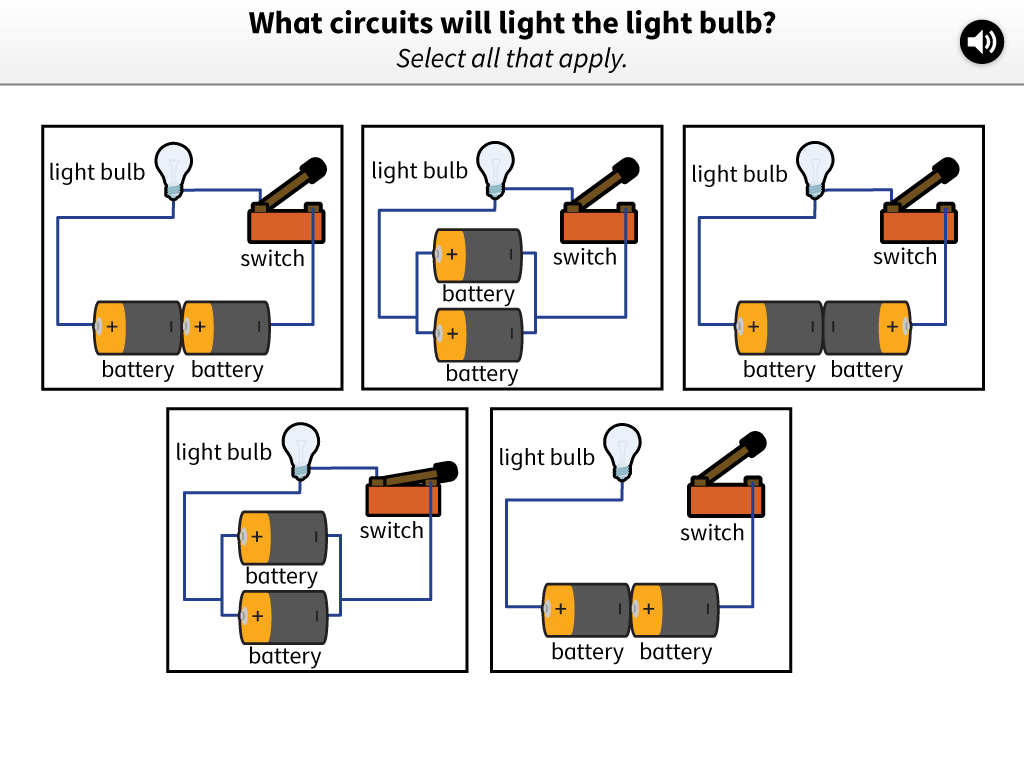
Interactive Art: selecting a correct answer would switch in a version of the graphic displaying a lit light bulb
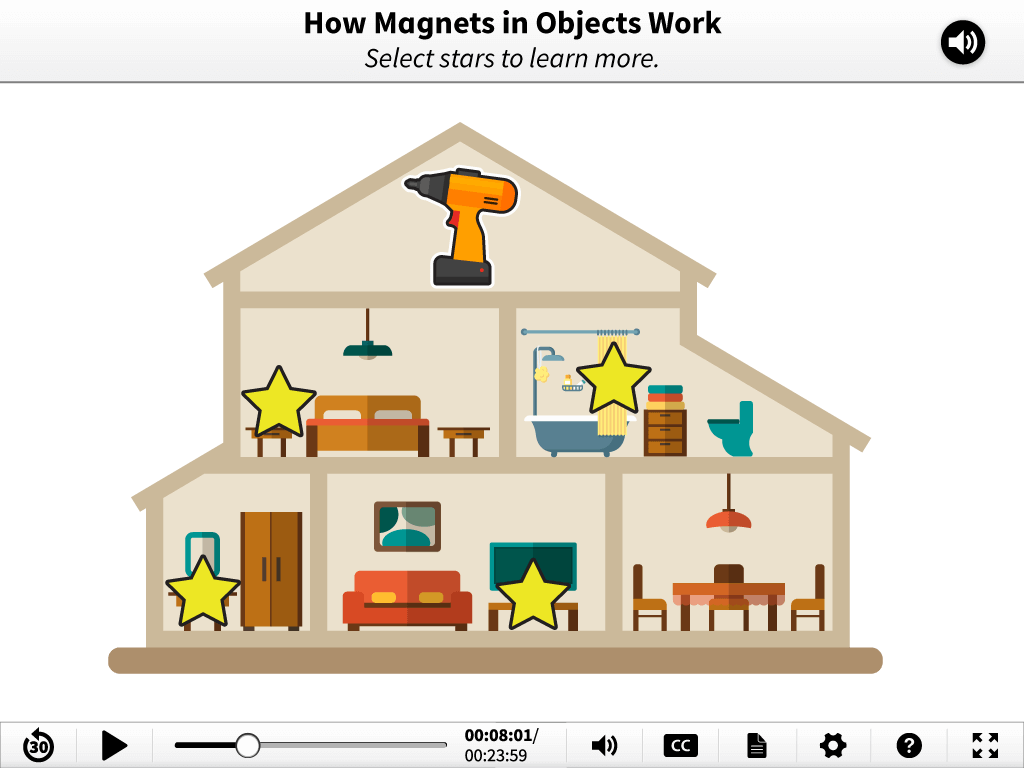
Interactive Art: clicking on a star near an item reveals an enlarged view of the object

Interactive Art: icons on the left appear outlined and trigger a revealed image when selected

Interactive Art: accompanying a lesson explaining the process, plant overlays appear on screen in succession to illustrate different stages of its growth cycle
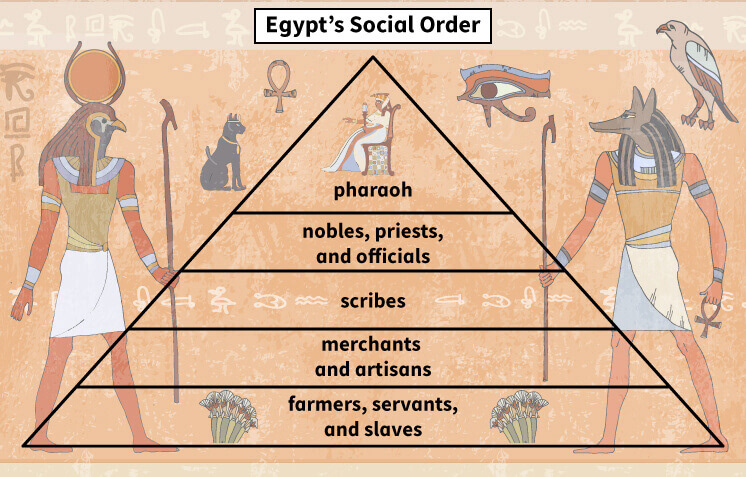
Interactive Art: draggable text answers would be dropped into the appropriate section of the pyramid graphic to complete this interactive exercise
